| SMOKE BEFORE AND DURING THE INJECTION | |
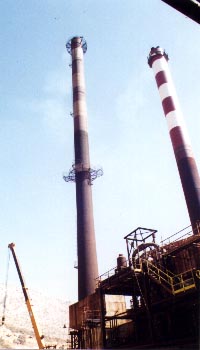
Chimney before injection | 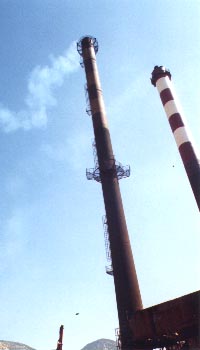
Chimney during injection |
|
| INJECTION OPTIMIZATION | |
| |
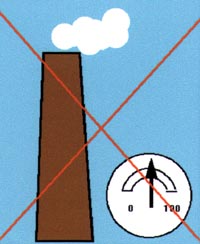
Figure n°1
Chimney before injection.
The smoke count is normal.
|
| |
| |
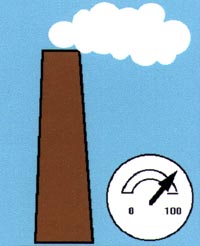
Figure n°2
Chimney during injection.
The intensity of the smoke is maximal.
Injection is optimal.
|
| |
| |
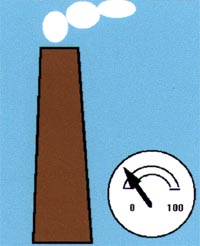
Figure n°3
Chimney during injection.
Smoke of average intensity.
Injection is not right.
Checking the injection is necessary.
|
| |
|
|
|